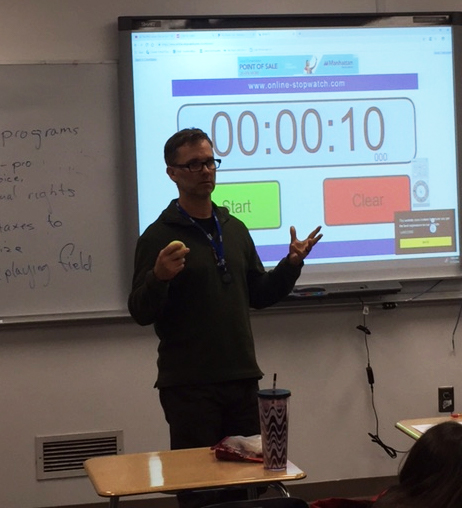
Todd, a teacher at Youth Services in the Crisis Residential classroom, incorporates fun activities into his lessons. One student, who was disinterested in the class, eagerly participated in the activity. Here’s Todd’s description of the lesson:
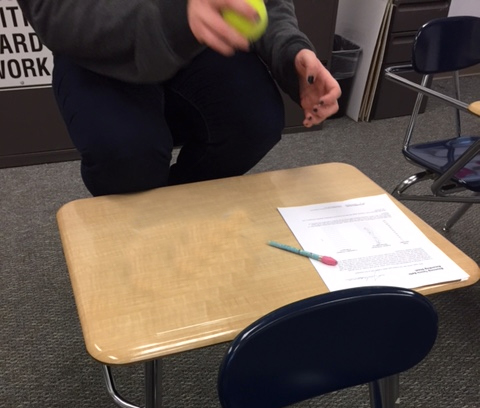
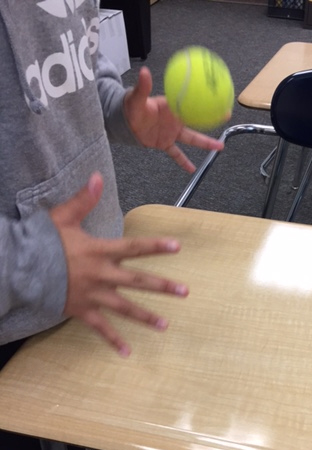
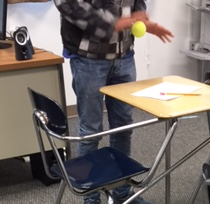
We bounced a tennis ball, counting how many bounces per 10 second intervals. We took a cumulative total and showed a positive correlation between time and bounces. We plotted the data on a graph and used technology to calculate the linear regression taken from a line of best fit. Once we had our equation, we could predict outcomes for any given time or using amount of bounces to predict the amount of time required.
You must be logged in to post a comment.